Best NFL Data Tools for Pro Bettors in 2026
Table of Contents
- Why NFL Data Tools Matter for Beating the Juice in 2026
- Quick Comparison: Best NFL Data Tools for Professional Bettors
- 1. EdgeLine NFL: Fair-Line Projections and Closing-Line Value Tracking
- 2. Juice Reel: Bet Tracking and Odds Comparison in One App
- 3. OddsJam: Pre-Game Odds Analysis
- 4. BettingPros: Bet Tracking and Market Activity
- NFL Odds Comparison Tools: Finding the Best Line
- NFL Betting Model Projections: How Fair Lines Are Built
- Frequently Asked Questions
Last Updated: October 21, 2026
Why NFL Data Tools Matter for Beating the Juice in 2026
At standard -110 pricing on both sides, you have to win roughly 52.4% of your bets just to break even, which is why so many bettors feel like they're treading water. The best NFL data tools for professional bettors exist to close that gap, and at EdgeLine NFL we build our platform around one question: does this number beat the fair line, or doesn't it?
Most bettors lose the juice battle before kickoff, taking a number off a screen without asking what the fair price should be.
Below, we break down the NFL data tools worth your attention in 2026, what each actually does, and how to calculate the vig so you know exactly what you're paying on every ticket.
Quick Comparison: Best NFL Data Tools for Professional Bettors
The table below compares the tools on what decides whether a tool helps you beat the juice: what it projects, data freshness, bet tracking, and API or commercial-use terms.
| Tool | Primary Strength | Best For | Bet Tracking | Fair-Line Projections | Data Freshness (verify) | API / Commercial Use (verify) |
|---|---|---|---|---|---|---|
| EdgeLine NFL | Fair-line projections vs. live lines | Bettors who want model edges | Yes, with verified results | Yes | Live line comparison; confirm update cadence on site | Confirm current terms at edgelinenfl.com |
| Juice Reel | Bet tracking and odds comparison | Multi-book bettors | Yes, via sportsbook sync | No | Odds comparison; confirm refresh rate in app | Confirm current terms with provider |
| OddsJam | Pre-game odds analysis | Line shoppers | Limited | No | Pre-game odds; confirm refresh rate with provider | Confirm current terms with provider |
| BettingPros | Bet tracking and market activity | Casual-to-serious bettors | Yes | No | Market activity; confirm refresh rate with provider | Confirm current terms with provider |
The right pick depends on what you're missing. If you shop lines well but can't tell a good number from a bad one, you need projections. If you have projections but bet across five books, you need comparison.
What the comparison does not tell you
A feature grid hides the three things that separate a professional tool from a hobbyist one: data quality, latency, and licensing.
- Data quality and source coverage. Ask which sportsbooks feed the odds, how deep the historical archive goes, and whether injury and weather feeds are included. A model trained on stale injury data will project a fair line for a quarterback ruled out an hour ago.
- Latency. A tool that refreshes every few minutes shows numbers that are already gone. For line shopping, faster is better; for closing-line-value tracking, you need the actual closing number, not a snapshot from twenty minutes earlier.
- Licensing and usage limits. If you plan to pull data into your own model, confirm whether the provider allows API access, how many calls you get, and whether commercial or redistribution use is permitted. Retail subscriptions often forbid exactly the workflow a professional wants.
A reproducible workflow beats any single tool
The tools above are inputs, not answers. A workflow that survives a season:
- Collect. Pull lines from at least three books and log the timestamp.
- Model. Compare each line to your fair-line projection and record the gap.
- Shop. Take the best available price on the side with a gap, not the first price you see.
- Stake. Size bets by edge and bankroll, not by confidence.
- Review. Log the closing line and compute closing-line value on every bet, winners and losers alike.
That loop separates bettors who beat the juice from bettors who just pick more games. EdgeLine NFL sits at the model and review steps, with fair-line projections compared against live sportsbook lines and closing-line value tracking so you can see whether the process is working. Get the Edge! Subscribe Now at https://www.edgelinenfl.com.
1. EdgeLine NFL: Fair-Line Projections and Closing-Line Value Tracking
EdgeLine NFL is an independent analytics platform that compares live sportsbook lines against proprietary fair-line projections to flag model edges.
Our platform separates official picks from lower-confidence model leans.
Injury-aware matchup analytics fold in team efficiency and weather, so a projection doesn't ignore a quarterback's status or a forecast.
We don't publish pricing here because plans and access change. Check our site for current details before subscribing.
Pros and Cons
Pros:
- Fair-line projections give you a reference price, not just a pick
- Official picks are tracked with verified results, separate from leans
- Injury and weather inputs are built into the matchup model
- Closing-line value tracking shows whether you beat the market
Cons:
- No free tier, so you can't test the model before committing
- It won't place bets or manage your bankroll for you
2. Juice Reel: Bet Tracking and Odds Comparison in One App
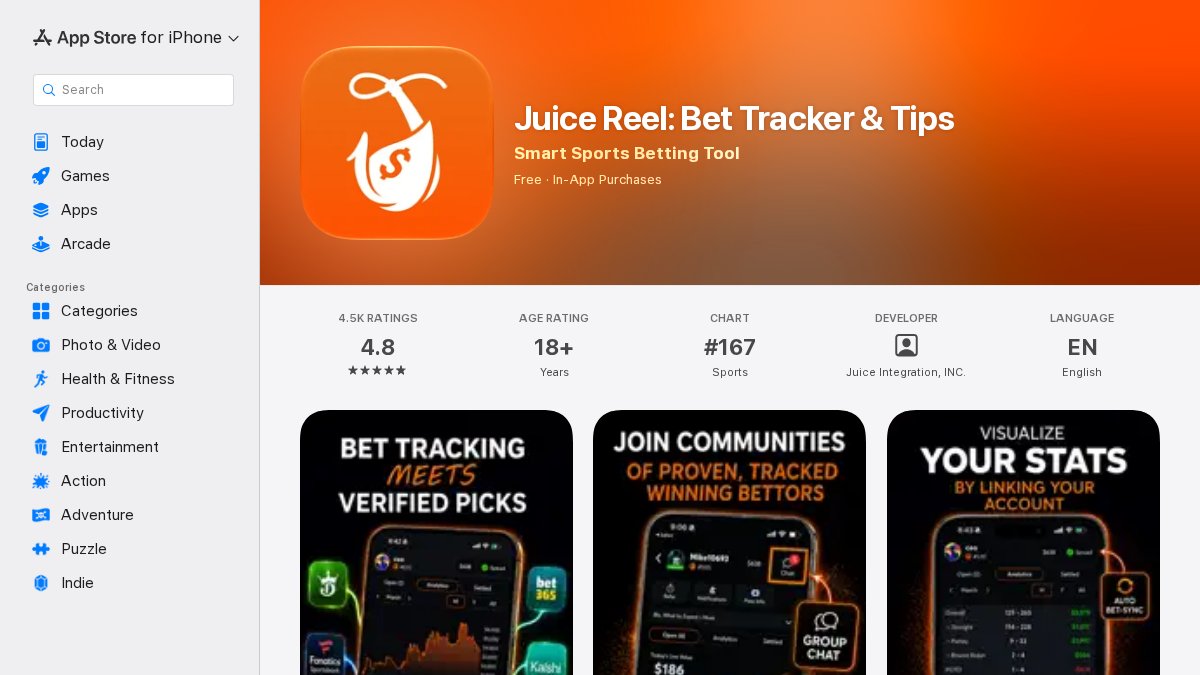
Juice Reel bundles bet tracking, odds comparison, and player prop tools into one app.
The odds comparison piece is genuinely useful if you hold accounts at multiple books; seeing the same game priced differently is the easiest edge in betting.
Where it falls short is projections. Juice Reel tells you what the market is doing, not what the fair price should be.
Pros and Cons
Pros:
- Automatic bet tracking removes manual entry
- Odds comparison across books is fast and useful
- Player prop tools and picks live in the same app
Cons:
- No fair-line projections, so it can't flag a soft number
- Pricing isn't listed in the available product information, so confirm before signing up
3. OddsJam: Pre-Game Odds Analysis
OddsJam is associated with pre-game betting opportunities and odds-related analysis, which puts it in the line-shopping camp rather than the projection camp.
If your workflow is finding the best available number across books before kickoff, a tool in this category earns its keep. If it's figuring out whether a number is fair, you'll still need a model on top of it.
Verify current features and pricing directly with the provider before you commit. We won't guess at them.
Pros and Cons
Pros:
- Focused on pre-game odds analysis
- Appears in established comparisons of betting tools
Cons:
- Limited verified detail on NFL-specific features
- Pricing and plan structure aren't confirmed in the available information
4. BettingPros: Bet Tracking and Market Activity
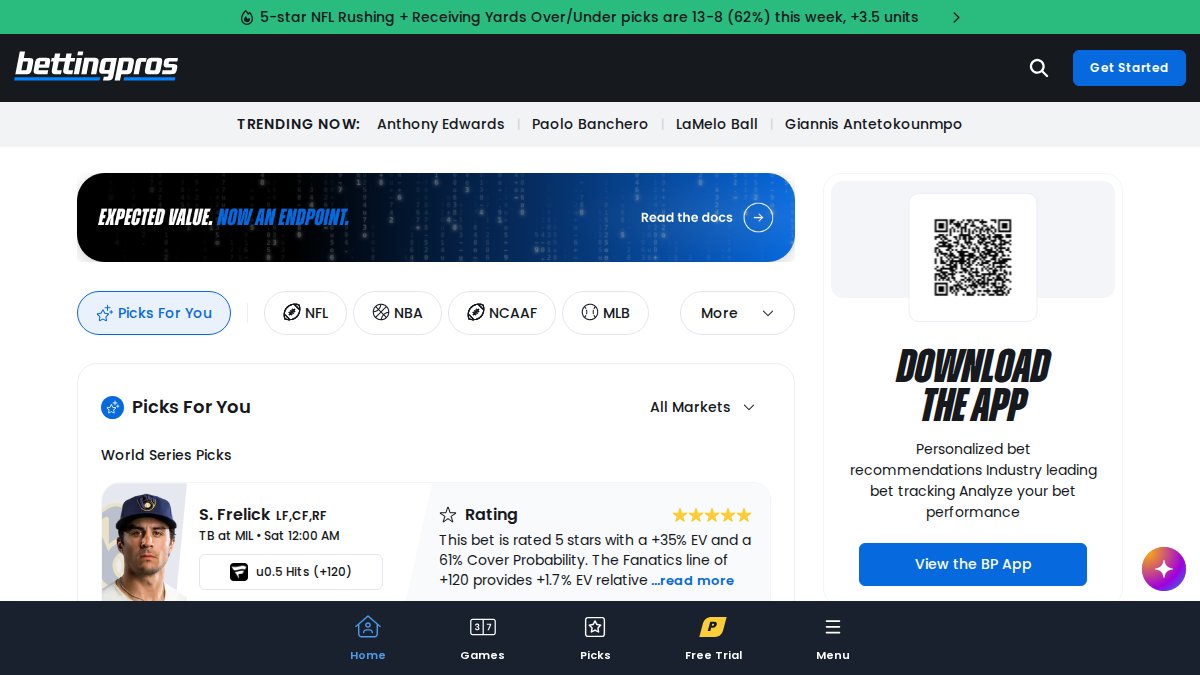
BettingPros is a sports betting tool with bet tracking at its core. The pitch is the same one you'll hear everywhere: log your bets, see your results, learn from the patterns.
That's worth something: most bettors don't know their record by bet type, and the ones who do tend to bet more selectively. But tracking is backward-looking.
If you're building a full workflow, BettingPros fits as the record-keeping layer.
Pros and Cons
Pros:
- Bet tracking is specifically called out in available comparisons
- Useful for reviewing your own results by category
Cons:
- Current pricing and plan details aren't verified in the available information
- No projections, so it can't identify a soft line
NFL Odds Comparison Tools: Finding the Best Line
Line shopping is the one edge every bettor can capture today, which is why NFL odds comparison tools deserve a permanent spot in your workflow. But before you shop, you need to know what you're shopping against: the vig, the hold, and the break-even rate.
The math of the juice
At standard -110 pricing on both sides, you risk $110 to win $100. The implied probability of each side is 110 / (110 + 100) = 52.4%.
The break-even rate changes with the price. At -105, the implied probability is 105 / 205 = 51.2%. At -115, it is 115 / 215 = 53.5%. Every few cents of juice you shave off moves your break-even rate, and over a season that compounds.
How line shopping attacks the hold
The same game is priced differently at different sportsbooks. One book may have the favorite at -3 (-110), another at -3 (-105), and a third at -2.5 (-110).
Before you bet, check at least three books for the same market. On spreads, half a point matters around key numbers. On moneylines and totals, a few cents of juice compounds across a season.
Price shopping versus projection
Line shopping and projection are different jobs, and you need both. Shopping finds the best price on a side you've already decided to bet; projection tells you whether the side is worth betting at all.
An NFL betting API can automate the shopping step if you're technical, but most retail bettors just need the discipline to open three tabs instead of one. Comparison tools like Juice Reel and OddsJam make that faster and are worth it if you bet volume.
NFL Betting Model Projections: How Fair Lines Are Built
Building one means combining inputs. Team efficiency on offense and defense. Injury status, especially at quarterback. Weather for outdoor games. Rest and travel.
The output is a probability, not a certainty.
That gap is the edge. Finding it consistently is the hard part, and it's why a reproducible workflow matters more than any single pick.
An NFL prop bet analyzer applies the same logic to player markets. If you want a practical starting point, our NFL picks page shows how official plays are separated from leans, which is the same discipline your own model needs.
The juice doesn't disappear because you found a tool. EdgeLine NFL gives you fair-line projections compared against live sportsbook lines, injury-aware matchup analytics, and closing-line value tracking so you can see whether your process is working.
Bet responsibly. If gambling is a problem for you or someone you know, call 1-800-GAMBLER.
Frequently Asked Questions
What are key numbers in football totals?
Key numbers are the most common margins of victory in NFL games, mainly 3 and 7. Because so many games land on those numbers, sportsbooks price spreads and totals around them carefully. A 3-point spread is not the same as a 3.5-point spread: pushing on 3 is common, while 3.5 removes that push. Understanding key numbers helps you judge whether a line move matters and whether a data tool's projection is actually on the right side of a number that decides many bets.
How do NFL betting tools identify value against sportsbook odds?
Most tools compare a live sportsbook line to an independent projection or fair line. If the tool's fair line differs from the book's line by enough to cover the juice, it flags a model edge. EdgeLine NFL, for example, compares live sportsbook lines with proprietary fair-line projections and separates official picks from lower-confidence leans. The value only exists if the projection is well calibrated and the line is still available, so check both before acting.
What data should an NFL betting model include?
A useful model includes team efficiency on offense and defense, pace, injury status for key players, weather for outdoor games, rest and travel, and historical performance against the spread. It should also track market movement so you can see whether the line has already adjusted. Data quality and freshness matter as much as the model itself: stale injury news or missing weather data can turn a good projection into a bad bet.
What is closing-line value in NFL betting?
Closing-line value (CLV) measures whether the line you bet was better than the final line before kickoff. If you bet a team at -2.5 and it closes at -4, you captured positive CLV. Over many bets, consistent positive CLV is one of the strongest signs a process is working, even when short-term results swing. EdgeLine NFL tracks closing-line value automatically so members can see whether their bets beat the market over time.