Using Fair Line Projections for NFL Betting

Table of Contents
- What Are Fair Line Projections and Why They Matter
- Understanding NFL Betting Model Methodology
- Sportsbook Line vs Model Projection: Identifying the Gap
- Step-by-Step: Building Your Own Fair Line Model
- Evaluating Sports Betting Model Accuracy
- Common Mistakes to Avoid When Using Fair Line Projections
- Optimizing Your Bankroll Management With Model Edges
- Frequently Asked Questions
Last Updated: October 2, 2026
What Are Fair Line Projections and Why They Matter
Fair line projections are probability-based estimates of what a game's true odds should be, independent of sportsbook pricing. They represent the actual likelihood of outcomes based on statistical modeling rather than market sentiment or betting volume.
The core difference between fair value and market lines matters enormously. A sportsbook line reflects both the true probability AND the house edge (called the "vig" or "juice"). Fair line projections strip away that markup. When your model's projection differs meaningfully from the sportsbook's published line, that gap signals a potential betting edge.
Most bettors chase the line. They see movement and assume the sportsbooks know something they don't. The reality is simpler: sportsbooks move lines to balance action, not because they've discovered new information. This is where data-driven approaches separate consistent winners from recreational players. Your edge comes from identifying when the market has mispriced an outcome relative to its true probability.
At EdgeLine NFL, we've built our entire platform around this principle. Comparing live sportsbook lines with proprietary fair-line projections lets you spot discrepancies before they close. That's where money gets made.
Understanding NFL Betting Model Methodology
Building a credible betting model requires understanding the components that actually move outcomes. Most casual bettors focus on a single factor, usually recent performance or star player status. Professional models weigh multiple variables simultaneously and account for how those variables interact.
Core Components of a Projection Model
An effective NFL projection model combines several layers of data. Start with baseline team efficiency: offensive yards per play, defensive yards allowed per play, and how those metrics correlate with wins. These efficiency numbers matter more than raw win-loss records because they show what teams actually accomplished relative to what they faced.
Next, layer in matchup-specific factors. Does this defense struggle against passing attacks? Is the opposing offense built around rushing volume? A model that treats every team the same across all matchups will miss consistent edges. Defensive line strength versus offensive line quality. Pass rush ability versus quarterback protection. These specific interactions drive outcomes.
Situational context adds another dimension. Home-field advantage is real but varies by team. Some squads play significantly better at home; others show minimal difference. Weather impacts certain teams more than others. A team built around a vertical passing attack performs differently in wind and cold than a ground-based offense. Division matchups carry different dynamics than non-division games.
Finally, incorporate recent trend data carefully. Form matters, but recency bias destroys models. A team that won three straight might simply have faced weak opponents. A team on a losing streak might have faced elite defenses. Context determines whether trends are meaningful or noise.
Accounting for Injuries and Depth Charts
Injuries represent the single largest source of model error. A backup quarterback playing for an injured starter changes game dynamics dramatically. Losing a top cornerback shifts defensive capability. Key offensive linemen departures affect pass protection and run blocking.
Track not just who's injured, but how significant the replacement is. Losing a third-string defensive end? Minimal impact. Losing your starting left tackle? Massive shift. Build injury adjustments that scale to replacement-level performance differential.
Depth chart analysis goes beyond identifying starters. Understand your league's backup talent levels. Some teams have capable backups; others have significant drops in performance when starters sit out. This context shapes how much to adjust your projections when injuries occur.
Sportsbook Line vs Model Projection: Identifying the Gap
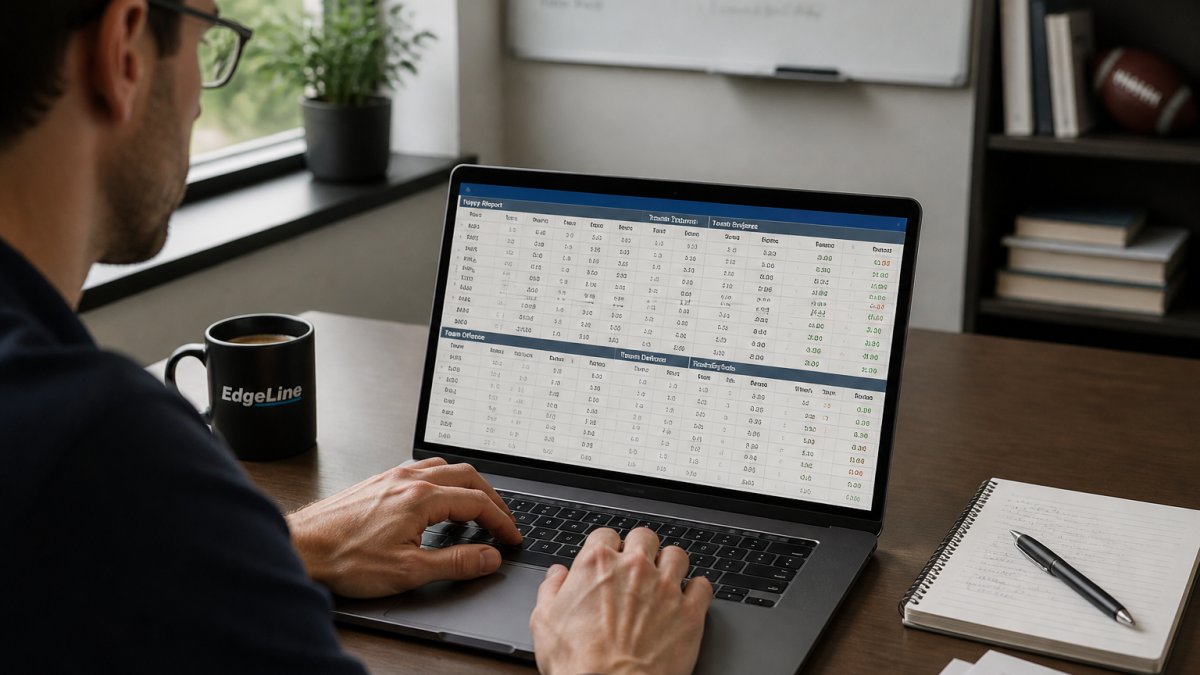
The gap between your fair line projection and the sportsbook's published line is where edges live. But not every gap represents value. You need a framework for distinguishing real opportunities from noise.
How Market Efficiency Affects Line Movement
Sportsbooks don't set lines to predict outcomes accurately. They set lines to balance action and protect their margin. When heavy money flows one direction, lines move to attract action on the opposite side. This creates inefficiency.
Market efficiency varies by game type. Major matchups between elite teams draw sharp money from professional bettors. Those lines tend to be tight and accurate. Mid-week games between less-popular teams draw more recreational action. Those lines contain more exploitable gaps.
The timing of line movement matters. Early-week lines reflect sharp opinion. Late-week movement often reflects recreational money chasing narratives. Understanding who's moving the line helps you evaluate whether the movement reflects new information or just action imbalance.
Spotting Discrepancies That Signal Value
A true edge requires two conditions: your projection must be more accurate than the market line, AND the difference must be large enough to overcome the sportsbook's vig.
If your model projects a team at 55% to win and the sportsbook offers -110 odds (implied probability around 52.4%), that's only a 2.6% gap. After accounting for the vig, that edge might disappear entirely. You need meaningful separation to generate positive expected value over time.
Look for situations where your model's inputs diverge from what the market appears to be pricing. If injury data shows a team significantly weakened but the line hasn't moved accordingly, that's a gap worth investigating. If weather forecasts suggest conditions that favor one team's style but the line remains unchanged, that's another potential edge.
Step-by-Step: Building Your Own Fair Line Model
You don't need advanced mathematics to build a functional projection model. A structured spreadsheet with clear logic can outperform intuition-based betting.
Step 1: Gather Your Data Sources
Start with reliable, consistent data sources. Official NFL statistics from sources like NFL.com's official statistics database provide the foundation. Team offensive and defensive efficiency metrics. Individual player performance data. Injury reports updated regularly.
Weather data matters more than most bettors realize. Temperature, wind speed, and precipitation affect passing accuracy and field conditions. Incorporate real forecasts, not just historical averages.
Create a single source-of-truth spreadsheet where you consolidate all inputs. Pulling data from five different places introduces inconsistency and errors. One organized system beats scattered information every time.
Step 2: Calculate Expected Value and Implied Probability
Convert sportsbook odds to implied probability. This is basic math: for -110 odds, divide 110 by (110 + 100) to get 52.38% implied probability. For positive odds like +120, divide 100 by (100 + 120) to get 45.45%.
Once you have implied probability from the market, compare it to your model's projection.
Step 3: Run Regression Analysis and Backtesting
Regression analysis identifies which variables in your model actually correlate with outcomes. You might think home-field advantage matters equally for all teams, but data might show it matters far more for some. Regression reveals these relationships.
Step 4: Monitor Closing Line Value and Variance
Closing line value measures whether your picks beat the line at the time you made them. This is the truest test of model accuracy. If you consistently beat closing lines, you have an edge. If you consistently lose to closing lines, your model needs adjustment.
| Metric | What It Measures | Why It Matters |
|---|---|---|
| Implied Probability | Market's estimated outcome likelihood | Baseline for comparing your projection |
| Expected Value | Mathematical edge per unit wagered | Determines long-term profitability |
| Closing Line Value | Performance vs. final market consensus | True measure of predictive accuracy |
| Sample Size | Number of bets evaluated | Determines statistical significance |
| Variance | Range of expected outcomes | Shows how much volatility to expect |
Evaluating Sports Betting Model Accuracy
Not all models are created equal. Some produce better predictions than others. You need objective criteria for measuring whether a model is actually working.
Key Performance Metrics and Sample Size
The most important metric is closing line value. Everything else is secondary. A model might show impressive accuracy on paper but consistently lose to the closing line. That model is worse than useless, it's expensive.
Avoiding Overfitting and Outlier Bias
Overfitting is the primary way bettors fool themselves. You add variables until your model perfectly explains historical data. But perfect historical fit often means terrible forward-looking predictions.
Common Mistakes to Avoid When Using Fair Line Projections
Most bettors sabotage their own models through behavioral and methodological errors.
Optimizing Your Bankroll Management With Model Edges
Even a profitable model will go broke if you bet incorrectly. Bankroll management determines whether your edge translates to actual profits.
Frequently Asked Questions
What is the difference between a sportsbook line and a fair line?
A sportsbook line is the odds a sportsbook offers bettors, designed to balance action and generate profit through the vig (commission). A fair line is your calculated probability of an outcome based on statistical modeling, independent of sportsbook margins. The gap between them reveals potential betting edges. When your fair line projection differs significantly from the sportsbook line, it signals an opportunity to find value.
How do you calculate a fair line for NFL betting?
Start by gathering historical team performance data, player metrics, and matchup variables. Run regression analysis to identify which factors best predict outcomes. Convert your probability estimate to decimal odds using the formula: 1 / probability. Backtest your model against past seasons to verify accuracy. Monitor closing-line value, the difference between your projection and the final sportsbook line, to validate your model's predictive power over time.
How can fair line projections help identify betting value?
Fair line projections reveal when sportsbooks have mispriced a matchup. If your model projects 55% probability for a team but the sportsbook implies 48%, that's a betting edge. By comparing your fair line against live market lines, you identify undervalued and overvalued outcomes. Tracking closing-line value shows whether your edges actually beat the market long-term, validating your nfl betting model methodology and informing future wager sizing.
What factors should be included in an NFL fair line model?
Core factors include offensive and defensive efficiency metrics, team strength of schedule, player performance baselines, and injury status. Advanced models incorporate weather conditions, home-field advantage, rest days, and line movement patterns. Each variable should be weighted based on historical predictive power through regression analysis. Avoid overfitting by testing your model on out-of-sample data and monitoring variance across different game scenarios and seasons.