Independent Model Edges & Probability Estimates

Table of Contents
- Why Independent Model Edges Matter in Sports Analytics
- How to Source Independent Probability Estimates Step by Step
- Sports Betting Model Accuracy: What Out-of-Sample Evaluation Reveals
- Fair Line vs Sportsbook Odds: Reading the Gap
- How to Calculate Betting Edge From Model Probabilities
- Combining and Comparing Multiple Independent Models
- NFL Betting Analytics Tools: What to Look For
- Conclusion: Turning Independent Estimates Into Smarter Decisions
- Frequently Asked Questions
Last Updated: October 4, 2026
Why Independent Model Edges Matter in Sports Analytics
Most bettors lose because they trust the same numbers everyone else sees. Independent model edges come from building your own probability estimates instead of copying the sportsbook's line.
At EdgeLine NFL, we built our platform around one idea: you cannot beat a market you never question.
Here is the problem. A sportsbook line is not a prediction. It is a price. It reflects public money, injury news, and the book's own margin.
So how do you get an independent number? You build one. Then you test it honestly. Then you compare it to the market.
How to Source Independent Probability Estimates Step by Step
Getting an independent estimate starts with clean data and honest testing. You need three separate data sets, and you must never let them touch.
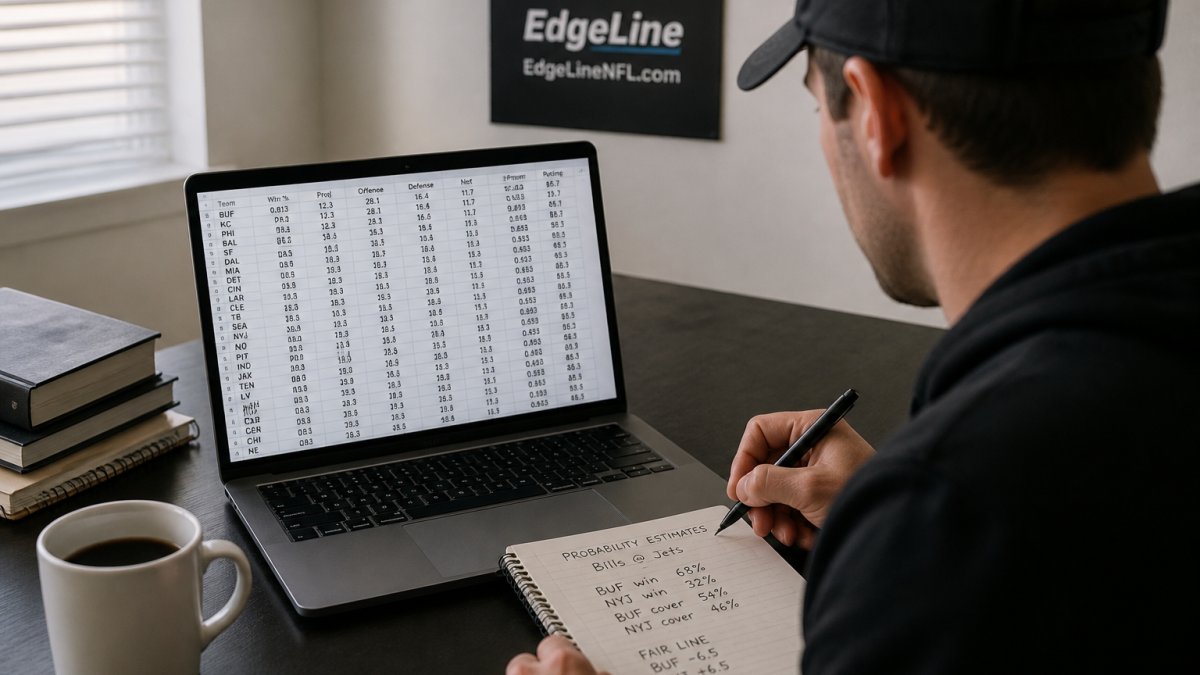
Separating Training, Validation, and Test Data
Split your data into three buckets before you build anything:
- Training data: the games your model learns from
- Validation data: the games you use to tune settings
- Test data: the games you touch once, at the very end
A common mistake is tuning your model on the test set. That inflates your results and fools you into thinking you have an edge you do not have.
Use a temporal split, not a random one. Sort every game by kickoff date, train on the earliest seasons, validate on the next block, and hold the most recent season as your test set.
Where Independent Estimates Actually Come From
There are four practical sources, and each has a different independence profile:
- Your own model. Highest independence, highest effort. You control the features, the target, and the versioning.
- A public model with published methodology. Useful as a cross-check, but only if the authors document their features and update cadence. Without that documentation, you cannot tell whether their number is independent or a repackaged market line.
- A market-derived baseline you build yourself. Convert a closing line to a no-vig probability and treat it as a benchmark, not as your forecast. This is the number you are trying to beat, not the number you submit.
- A blend of the above, weighted by out-of-sample performance. This is the most defensible option, but only after each component has been evaluated on its own test set.
Whichever source you use, record provenance for every estimate: the model version, the data snapshot date, the feature list, and the exact timestamp the estimate was generated. If you cannot reproduce the number six months later, you do not have an independent estimate, you have a memory.
Operational Checks for Data Leakage and Drift
Data leakage happens when future information sneaks into your training data. Say your model "knows" a team's final record before the season ends. That is cheating, even if you did it by accident.
Run these checks before you trust any backtest:
- Timestamp every feature. Confirm each input was published or observable before kickoff. Injury reports, depth charts, and weather forecasts all have release times that matter.
- Audit your joins. A merge on team name that pulls in season-end aggregates is the most common silent leak.
- Track performance over rolling windows. If accuracy jumps in one month and collapses the next, you likely have drift, not edge.
- Version your data and your model. Log the snapshot date, the code commit, and the hyperparameters so a result can be reproduced exactly.
- Re-run the test set once. If you keep re-running it to check a tweak, it is no longer a test set.
Sports Betting Model Accuracy: What Out-of-Sample Evaluation Reveals
Out-of-sample evaluation is the only honest test of sports betting model accuracy. It measures how your model performs on games it has never seen.
In practice, most models look strong in training and weaker in testing. That drop is normal. The size of the drop tells you how much you overfit.
Watch for these signals:
- A small gap between training and test results means your model generalizes well
- A large gap means it memorized noise instead of learning patterns
- A model that beats the market in testing is rare, and you should double-check the data
Generalization to unseen games is the whole point. A model that only works on last season's games is useless on Sunday.
Fair Line vs Sportsbook Odds: Reading the Gap
The fair line is your best estimate of the true odds, with no margin baked in. The sportsbook line includes the book's cut. Reading that gap is how you find value.
Here is how the two compare:
| Factor | Fair Line | Sportsbook Odds |
|---|---|---|
| Source | Your model | Market consensus |
| Margin | None | Built in |
| Purpose | True probability | Price to bet |
| Your use | Benchmark | Compare against |
If your fair line says a team wins 55% of the time, the fair odds are about -122. If the book offers -110, you have a gap worth exploring. If the book offers -140, the value is gone.
How to Calculate Betting Edge From Model Probabilities
Learning how to calculate betting edge comes down to one formula. Compare your probability to the implied probability of the odds.
Edge = (your probability × decimal odds) - 1
If the result is positive, you have an edge. If it is negative, you do not.
Converting American Odds to Decimal First
Most sportsbook prices are quoted in American odds, so convert before you calculate:
- Positive odds (+150): decimal = (odds / 100) + 1 = 2.50
- Negative odds (-130): decimal = (100 / |odds|) + 1 = 1.769
Then compute edge the same way. A +150 underdog at a 45% model probability gives (0.45 × 2.50) - 1 = 0.125, a 12.5% edge. The same probability at -130 gives (0.45 × 1.769) - 1 = -0.204, a negative edge. Same forecast, opposite decision, the price is the whole story.
Worked Example: Converting Win Probability to a Decision Edge
Suppose your model gives a team a 60% win probability. The sportsbook offers +120, which converts to decimal odds of 2.20.
Edge = (0.60 × 2.20) - 1 = 0.32
That is a 32% edge, which is large. Most real edges are far smaller. A 2-5% edge is often enough to matter over many bets.
Adjusting Edge for Uncertainty
A point estimate is not a decision. If your model says 60% but your uncertainty interval spans 52% to 68%, the edge at the low end may be negative. Before you bet, ask:
- How wide is the interval? A wide interval means the point estimate is fragile.
- How many comparable games back the estimate? Small samples produce wide intervals.
- Does the edge survive the low end of the interval? If not, pass.
A practical rule many analysts use: require the edge to remain positive at the lower bound of your interval before treating it as actionable. That single check removes most of the bets that look good on paper and lose in practice.
Market-Specific Edge Mechanics
Edge looks different depending on what you are pricing:
- Moneyline: the formula above applies directly. Compare your win probability to the no-vig implied probability of the two-way market.
- Spread: convert your model's margin distribution into a cover probability at the posted number, then apply the same formula. A half-point of line value can swing the edge by several percentage points.
- Totals: model the full distribution of combined points, not just the mean. The probability of clearing the number is what matters, not the projected total.
- Player props: the same logic applies, but sample sizes are smaller and uncertainty intervals are wider, so require a larger edge to act.
Avoiding Double-Counted Edges
If you run three models and all three show a 4% edge on the same game, that is not a 12% edge. Correlated models share features, data, and assumptions. Treat their agreement as one estimate with a narrower interval, not as three independent confirmations. The only time multiple estimates add up is when they were built on genuinely different data or methods, and even then, weight them by out-of-sample performance rather than averaging blindly.
Combining and Comparing Multiple Independent Models
One model is a guess. Several independent models, compared side by side, give you a range you can trust.
Build a simple ensemble:
- Run two or three models with different methods
- Average their probabilities for a blended estimate
- Flag games where the models disagree sharply
When models disagree, your uncertainty is high. When they agree, your confidence rises. That spread is your uncertainty interval, and it matters as much as the point estimate.
For decision-making, treat a wide spread as a signal to pass. A narrow spread with a positive edge is your best bet.
NFL Betting Analytics Tools: What to Look For
The right NFL betting analytics tools do three things well. They show you independent projections, they track results honestly, and they separate high-confidence picks from low-confidence leans.
Check for these features before you commit:
- Fair-line projections you can compare to live lines
- Verified performance tracking, not just backtests
- Injury and weather data built into the model
- Market movement and closing-line value tracking
- Clear confidence tiers for every pick
EdgeLine NFL was built around exactly these needs. We compare live sportsbook lines against our own fair-line projections, then track every official pick in public.
Skeptical that any tool can beat the books? Fair. No model wins every week. The goal is a small, repeatable edge over many bets, tracked in the open.
Conclusion: Turning Independent Estimates Into Smarter Decisions
The gap between a good bettor and a losing one is not luck. It is process. Build your own estimates, test them honestly, and only act when your number beats the market's.
That is the entire game. Independent estimates, honest evaluation, and the discipline to pass when the edge is not there.
If you want professional-grade NFL analytics without building a model from scratch, EdgeLine NFL gives you fair-line projections, injury-aware forecasts, and transparent tracked results. Unlock Member Picks and see the edges for yourself. Subscribe Now.
Frequently Asked Questions
What is a model edge in sports betting?
A model edge is the gap between your model's fair probability and the implied probability from a sportsbook's odds. If your model gives a team a 58% win probability and the sportsbook's line implies 52%, the 6-point difference is your edge. Positive edges suggest value; negative edges suggest the line is priced against you. Consistently finding edges requires independent estimates, not recycled public numbers.
How do sports betting models calculate probability estimates?
Models estimate win probability by combining inputs like team efficiency, player movement data, injury status, and situational factors into a statistical framework. They train on historical games, validate on separate seasons, and test on unseen data to check generalization. Well-calibrated probabilities match observed outcomes: a 70% forecast should win roughly 70% of the time across many predictions.
How do you compare a model's fair line with a sportsbook line?
Convert both to probabilities. A sportsbook line of -150 implies about 60% probability; +130 implies about 43%. Your model's fair line, converted the same way, shows where the two disagree. A meaningful gap (typically 3-5 percentage points after removing vig) signals a potential edge. Track closing-line value to see whether your number beat the market's final price.
Can sports betting models beat sportsbooks over time?
Some independent models have shown positive closing-line value over large samples, but the margin is thin and the market adapts. Success depends on out-of-sample performance, probability calibration, and disciplined bankroll management. A model that looks strong on backtests but fails on unseen games is overfit. Track verified results over hundreds of bets, not dozens, before drawing conclusions.