How to Verify Sports Handicapper Results

Table of Contents
- Why Verifying Sports Handicapper Results Matters
- Step 1: Request Documented Win-Loss Records and Pick History
- Step 2: Evaluate Sports Betting Record Verification Methods
- Step 3: Calculate Handicapper ROI and Units Tracked
- Step 4: Assess Closing Line Value Betting Performance
- Step 5: Use Sports Betting Pick Tracking Tools
- Red Flags That Indicate Misleading Handicapper Claims
- Frequently Asked Questions
Last Updated: October 12, 2026
Why Verifying Sports Handicapper Results Matters
Trusting a sports handicapper without the ability to verify sports handicapper claims is betting blind. Many bettors lose money to fabricated records and cherry-picked results. When you verify sports handicapper performance, you protect your bankroll and bet on data instead of hype.
A handicapper claiming a 60% win rate might be hiding losses, inflating units, or tracking only their best picks. This guide shows you how to audit a track record and separate real performance from exaggerated claims.
Here's how to audit any handicapper yourself.
Step 1: Request Documented Win-Loss Records and Pick History
Ask for their complete pick history, not highlights, not their best month. Everything.
A legitimate handicapper will provide:
- Every pick made (date, sport, matchup, pick details)
- The odds at which the pick was made
- The result (win, loss, push, void)
- The units wagered on each pick
- A clear record spanning at least one full season
If they refuse or offer only partial records, that's a red flag. Documented results are the foundation of verification.
Request the data as a spreadsheet so you can calculate your own metrics and verify their claims independently.
Step 2: Evaluate Sports Betting Record Verification Methods
Once you have the pick history, verify it independently. But first understand what each verification method actually proves, and what it leaves out.
Third-party verification is the gold standard, with caveats. Sportsbooks and independent tracking platforms like Unabated's public leaderboards timestamp picks and link them to actual sportsbook results. If a handicapper's picks are tracked on an independent platform with sportsbook-linked verification, you can pull their actual record directly.
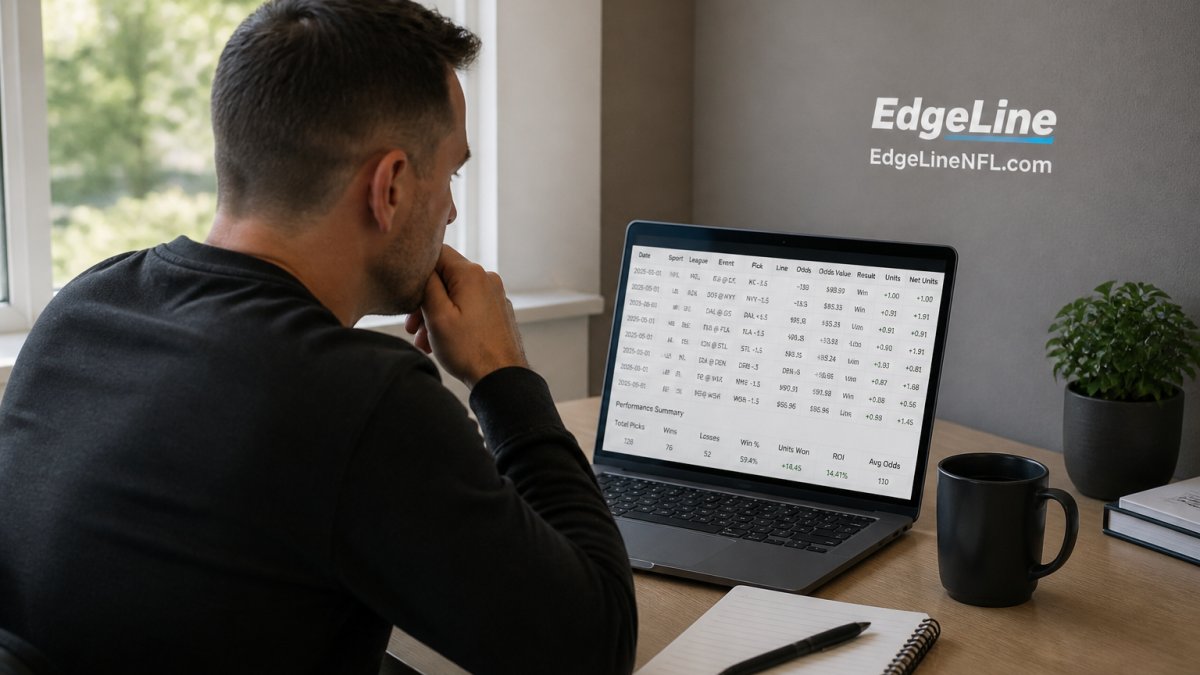
What verification actually proves, and what it does not
A verified record proves picks were logged before games started and graded against real market data. It does not prove:
- Account coverage. A handicapper may run multiple accounts and only publish the one with the best record. Verification covers the tracked account, not every bet the person placed.
- Pick completeness. Some platforms let a user delete, hide, or backfill picks. Ask whether the platform locks picks once submitted and whether deletions are visible in the history.
- Stake accuracy. A verified win-loss record does not always verify the unit size actually wagered. A handicapper can claim 5 units on winners and 1 unit on losers while the platform only logs the pick, not the stake.
- Conflict of interest. Some "independent" leaderboards earn affiliate revenue from the handicappers they rank, giving them an incentive to keep popular tippers looking profitable. Check the platform's monetization before treating rankings as neutral.
Compare verification methods side by side
- Sportsbook-linked tracking: Picks are recorded before the game and linked to live sportsbook data. Strongest form of verification. Limitation: only covers the linked account.
- Independent public leaderboards: Third-party platforms track picks and results in real time. Limitation: check for affiliate relationships and whether picks can be edited after submission.
- Timestamped records: The pick date, time, and odds are recorded before the game. This prevents retroactive adjustments. Limitation: a timestamp only matters if the platform enforces it, a self-hosted timestamp is worthless.
- Public results pages: The handicapper posts results on their website or social media in real time. Limitation: self-reported, editable, and easy to curate.
- Audit trails: You can trace each pick from prediction to outcome without gaps. Limitation: gaps are often hidden in the fine print, a missing week, a switched platform, or a "system update" that resets the record.
If the handicapper reports results only on their own website, they control the narrative and you can't verify independently.
A quick conflict-of-interest check
Before trusting a verification source, answer three questions:
- Who pays the platform? If handicappers pay for placement, rankings may reflect ad spend as much as performance.
- Can picks be edited or deleted after submission? If yes, the record is only as honest as the handicapper.
- Does the platform disclose its grading rules? Inconsistent handling of pushes, voids, and parlays lets identical picks show different records.
A verified record is a starting point, not a verdict. Treat it as one input alongside your own audit of the raw pick log.
Step 3: Calculate Handicapper ROI and Units Tracked
Numbers tell the story only if you calculate them the same way every time. Inconsistent grading is the biggest reason two people reach opposite conclusions from the same pick log. Fix that first.
Establish grading rules before you calculate anything
A record is only comparable if pushes, voids, and parlays are handled the same way across every pick. Apply these rules uniformly:
- Push: The bet is refunded. It counts as 0 units risked and 0 units profit. Do not count it as a win, and do not count it as a loss.
- Void / no-action: Same as a push, 0 units risked, 0 units profit. Common when a game is canceled or a player is scratched.
- Half-win / half-loss (Asian-style lines): Grade as +0.5 units or -0.5 units on a 1-unit bet, not as a full win or loss.
- Parlay: Grade the entire ticket as one bet at the stated stake. Do not break it into legs and count partial wins.
- Teaser / adjusted line: Grade at the adjusted line and adjusted odds, not the original market price.
- Free play / promo bet: Exclude from ROI unless the handicapper is transparent that it was a promo. A free-play winner returns less real money than a cash winner.
If a published record doesn't state these rules, ask. Selective grading, counting pushes as wins or excluding parlay losses, is a common way a losing record is made to look profitable.
Worked example: a five-pick sample
Here is a small pick log graded under the rules above. Assume a flat 1-unit stake on each pick and standard -110 pricing unless noted.
| Pick | Odds | Stake | Result | Units risked | Units profit |
|---|---|---|---|---|---|
| NFL spread | -110 | 1u | Win | 1.0 | +0.91 |
| NFL total | -105 | 1u | Loss | 1.0 | -1.00 |
| NBA moneyline | +150 | 1u | Win | 1.0 | +1.50 |
| NBA spread | -110 | 1u | Push | 0.0 | 0.00 |
| NFL parlay (3-leg) | +600 | 1u | Loss | 1.0 | -1.00 |
Totals: 4.0 units risked (the push is excluded), +0.41 units profit.
ROI = profit ÷ units risked = 0.41 ÷ 4.0 = 10.25%.
Grade the push as a win instead: units risked becomes 5.0, ROI drops to 8.2%, and the win rate looks better than it is. Same picks, different rules, different story, which is why grading rules matter more than the headline ROI.
Why win percentage misleads
A 55% win rate looks good on paper, but if they bet 5 units on confident picks and 1 unit on leans, profit depends on whether they're right on the big bets. A 55% record with 5-unit losses can still be a losing year.
Track units separately:
- Units on picks marked as high confidence
- Units on picks marked as medium confidence
- Units on picks marked as low confidence or leans
If the handicapper is consistently profitable, unit-weighted results will show it. If not, no marketing can hide it.
How changing odds distort unit math
A pick logged at -110 and one at -130 are not the same bet, even if both win. On a 1-unit stake:
- A -110 winner returns +0.91 units.
- A -130 winner returns +0.77 units.
- A +120 winner returns +1.20 units.
If a handicapper logs winners at the best price but losers at a worse one, the record is inflated. Re-grade every pick at the price available when it was published, not the best price later in the day. This is the fastest way to catch a record that only works on paper.
Step 4: Assess Closing Line Value Betting Performance
Closing-line value is where real edge lives, the difference between the odds a handicapper got and the odds the market settled on at game time.
Betting NFL games at -110 when the line closes at -115 means worse value than the market, which kills profitability over time. Consistently better closing-line value signals good market timing or genuine edges.
Here's what to check:
- Opening odds vs. closing odds: Did the handicapper get the better price?
- Consistent closing-line value: Do they beat the closing line on most picks, or just sometimes?
- Sport and market specifics: Closing-line value varies by sport. NFL closing lines are tight and efficient. Smaller sports have more movement.
Calculate it for a sample of picks:
- Note the odds when the pick was made
- Find the closing odds (the line at game time)
- Compare: better opening odds = positive closing-line value
- Average the closing-line value across all picks
If the handicapper's average closing-line value is positive, they're getting better prices than the market. That's a legitimate edge indicator.
Step 5: Use Sports Betting Pick Tracking Tools
Tracking tools automate verification and let you compare results across handicappers.
Sports betting pick tracking platforms let you:
- Import pick history automatically
- Calculate ROI, win rate, and unit tracking in real time
- Compare performance across different sports and bet types
- Track closing-line value without manual calculation
- Monitor long-term trends and streaks
These tools handle the math so you can interpret results. Still spot-check a few picks manually to confirm the tool uses the right odds and grading rules, a tool is only as good as its data.
Red Flags That Indicate Misleading Handicapper Claims
Watch for these warning signs that a handicapper's results aren't what they claim.
Cherry-picked results: They show their best month or year, not their full track record.
No documented methodology: They won't explain how they pick games.
Selective bet types: They only report results on moneylines or spreads, never on totals.
Guaranteed results: No one guarantees wins.
Testimonials only: They show customer screenshots but no independent verification.
No loss documentation: They report wins but hide losses.
Verifying a sports handicapper takes work, but trusting claims without evidence costs money.
Frequently Asked Questions
How can you verify a sports handicapper's track record?
Request documented pick history with timestamps, odds, and results from a third party or sportsbook-linked tracking system. Verify the sample size is meaningful (at least 50-100 picks), check that picks were posted before games started, and confirm ROI and units are calculated consistently. Cross-reference against independent leaderboards if available. Avoid relying solely on screenshots or claims without external verification.
What statistics should you check when evaluating a sports handicapper?
Examine win-loss record, ROI (return on investment), yield, units won or lost, average odds, and closing-line value. A strong handicapper shows consistent profitability over a large sample size, not just short-term winning streaks. Compare their average odds to the lines they claimed to pick at, and verify that unit tracking is transparent. Long-term historical results matter far more than recent performance.
Is a handicapper's win percentage enough to prove profitability?
No. Win percentage alone is misleading because it ignores odds and bet sizing. A handicapper with a 55% win rate on -110 juice could be profitable, while a 60% win rate at high odds might not be. Always examine ROI and units won alongside win-loss records. Profitability depends on the odds at which picks were placed and how bankroll was managed, not just how many games were won.
What does closing line value tell you about a handicapper?
Closing-line value (CLV) measures whether a handicapper's picks were placed at better odds than the final line before kickoff. Positive CLV suggests the handicapper found genuine market edges and bet before sharp money moved the line. This metric is more predictive of future performance than win-loss record alone because it shows whether picks captured real value or just got lucky. Track CLV over time to separate skill from variance.