Best Sports Betting Software for CLV and Model Edges
Last Updated: October 22, 2026
Quick Summary
The best sports betting software for tracking closing line value and identifying model edges records the price you actually took, then compares it to a timestamped closing line from the same book and to an independent projection. EdgeLine NFL pairs fair-line projections with automated CLV tracking, while Pikkit and BetSmart focus on CLV review and synced bet records.
- Closing line value is the difference between the odds you bet and the closing odds on that same market.
- An unauditable CLV figure, with no stated book or timestamp, is a marketing number rather than evidence.
- Convert every price to implied probability and remove the vig before comparing your bet to the close.
- Capture the closing line from the same sportsbook you bet at, within minutes of kickoff.
- Review CLV in blocks of at least 100 bets and separate spread, moneyline, and totals in your report.
Table of Contents
- What the Best Sports Betting Software Must Do for CLV and Model Edges
- Quick Comparison: Sports Betting Software for CLV and Model Edges
- EdgeLine NFL: Independent Fair-Line Projections With Automated CLV Tracking
- Pikkit: A Closing Line Value Tracker Built for Bet Review
- OddsJam: Real-Time Odds Comparison and Positive EV Tools
- BetSmart: Synced Bet Tracking With ROI and CLV Reporting
- How to Track Closing Line Value Without Fooling Yourself
- Validating a Sports Betting Model Edge Beyond a Single CLV Figure
- Frequently Asked Questions
What the Best Sports Betting Software Must Do for CLV and Model Edges
The best sports betting software for tracking closing line value and identifying model edges does two jobs at once: it records the price you actually took, and it compares that price to the closing line and to an independent projection. This guide from EdgeLine NFL breaks down what separates real analytics from a scoreboard with extra steps.
Closing line value (CLV) is the difference between the odds you bet and the closing odds on that same market. Beat the close consistently and you have evidence, not a hunch.
Here's the tension most buyers miss.
Below, we compare several platforms on how they handle CLV, odds data, and model validation, then walk through a tracking method you can run yourself.
How We Evaluated Each Platform
Every platform was scored on four criteria: automatic CLV tracking, transparency of odds sourcing, separation of model probability from betting value, and how usable the bet history is for reviewing decisions later.
Our ratings reflect the features each platform publicly documents, plus what a serious bettor needs to validate an edge over a full season.
Two things we did not penalize: the absence of a free tier, and the absence of published pricing. Neither tells you whether the CLV math is sound.
Quick Comparison: Sports Betting Software for CLV and Model Edges
The table below is a feature matrix, not a scoreboard. Each row answers the same three questions: does the tool track CLV, how does it source the closing line, and does it separate model probability from betting value?
| Platform | Core Strength | CLV Tracking | Closing-Line Source | Model Edge Tools | Best For |
|---|---|---|---|---|---|
| EdgeLine NFL | Independent fair-line projections vs. live lines | Automated market movement and CLV tracking | Same-book close, timestamped | Fair-line projections, tiered confidence, official picks vs. leans | NFL bettors who want projections and CLV in one place |
| Pikkit | CLV review across bet types | Automatic on straight bets, props, parlays | User-selectable reference book | None documented | Reviewing CLV after the fact |
| OddsJam | Real-time odds comparison | Not documented | Not documented | Positive EV tools | Finding price differences across books |
| BetSmart | Synced bet records | ROI and CLV reporting | Not documented | None documented | Keeping clean records with performance tracking |
How to read the matrix
A tool can score well on CLV tracking and still give you a number you cannot compare to anyone else's. The column that matters most is closing-line source.
The second column to check is model edge tools. Odds comparison and bet tracking are record-keeping and price-finding functions; neither tells you whether a side is a good bet at a given price.
What the matrix does not tell you
Feature matrices reward checkboxes, so treat this one as a starting filter, not a verdict. Three things outside the table matter just as much:
- Import workflow: manual entry, sportsbook syncing, and CSV or API imports each handle voids, partial cash-outs, live bets, and line changes differently. A synced record that mislabels a cash-out will corrupt your CLV history.
- Odds normalization: a tool that averages American odds without converting to implied probability and removing vig will report CLV that drifts with the book's margin.
- Sample size handling: a report that shows CLV week to week invites you to overreact to noise. Look for tools that let you slice by bet type and by sample block.
The pattern is clear: most tools do one half of the job well. Odds comparison finds a price; a bet tracker records what happened. Very few connect a projection to a line and grade the result against the close, and fewer still document how they do it.
For a deeper look at how EdgeLine NFL separates official picks from lower-confidence leans and tracks both against the close, see the platform section below. Get the Edge! Subscribe Now at https://www.edgelinenfl.com.
EdgeLine NFL: Independent Fair-Line Projections With Automated CLV Tracking
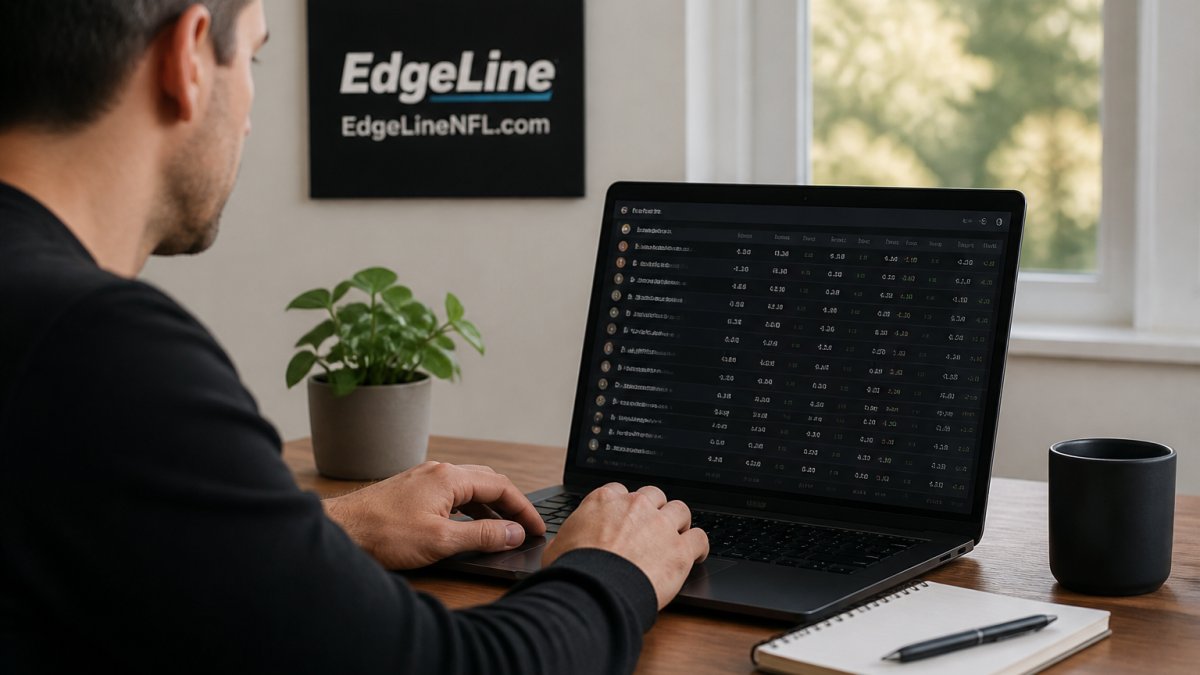
EdgeLine NFL is built around comparing live sportsbook lines to proprietary fair-line projections, then tracking how those numbers move. That combination is the point.

The platform separates official picks from lower-confidence model leans, so you can see which plays carry full model backing and which are closer to a coin flip.
The value here is the separation of probability from price.
Pricing depends on the plan you choose, so check the site for current rates and access levels.
Pikkit: A Closing Line Value Tracker Built for Bet Review
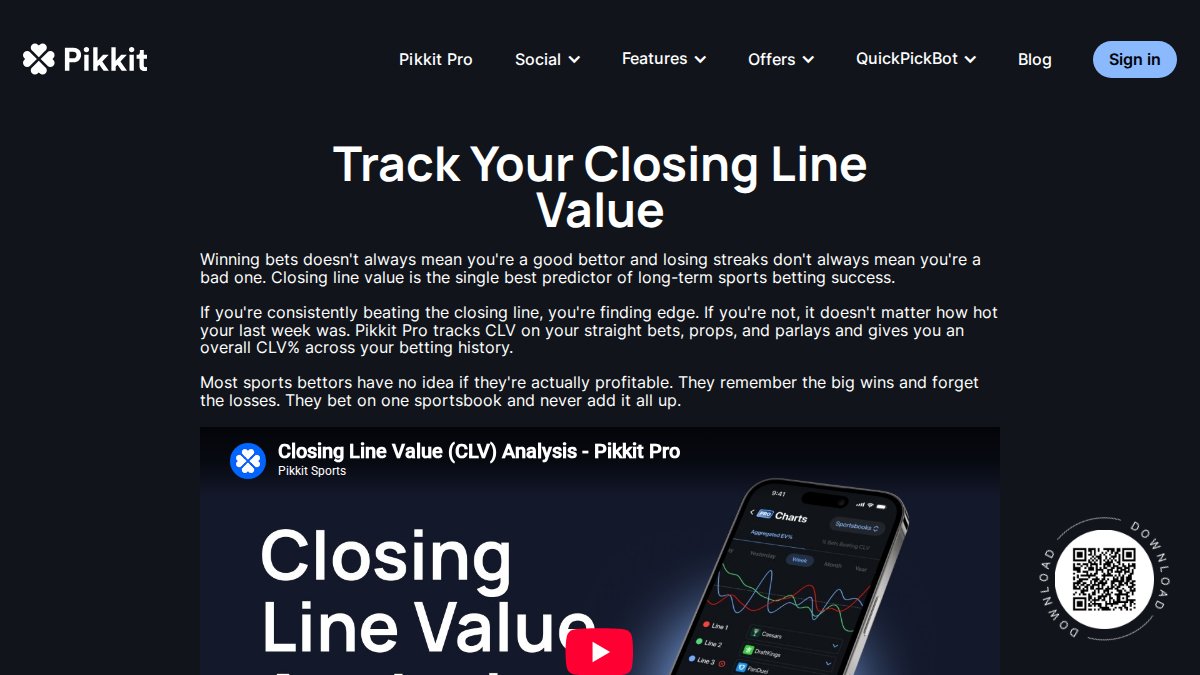
Pikkit Pro handles the part most bettors skip: it automatically tracks closing line value on straight bets, props, and parlays, and calculates CLV whenever odds are available for that market.
That flexibility matters: if you bet a prop at one book and the tool compares it to a different book's close, your CLV number is fiction.
The honest limitation: CLV only calculates when odds exist for the market, so thin props and niche markets may drop out of your report. Confirm pricing before signing up.
OddsJam: Real-Time Odds Comparison and Positive EV Tools
OddsJam's strength is speed of comparison: real-time odds across books and positive expected value tools that flag prices above a fair estimate.
If your workflow starts with line shopping, this is a reasonable front door.
Where it falls short for this specific job: the supplied materials don't document CLV tracking, so you'd need a separate tracker to grade your bets against the close.
BetSmart: Synced Bet Tracking With ROI and CLV Reporting
BetSmart's bet-tracking feature auto-syncs your wagers, then reports ROI and closing line value alongside your records, one clean ledger instead of a spreadsheet.
Auto-syncing removes the most common failure in manual tracking: forgotten bets.
What the supplied materials don't explain is how CLV is calculated or which markets are covered, and pricing isn't stated. Ask those questions directly before you commit.
How to Track Closing Line Value Without Fooling Yourself
Tracking CLV honestly comes down to four rules: log the bet when you place it, record the exact odds and the book, capture the closing line from that same book, and never edit the record afterward. Everything below is the plumbing that makes those rules hold up over a season.
Here is the workflow we would run:
- Log the wager before the game starts, with book, market, line, and odds
- Note the timestamp, not just the date
- Capture the closing line from the same sportsbook
Normalize the odds format first
American odds are not linear, so averaging them directly is a mistake. Convert every price to implied probability first.
- Negative American odds: implied probability = |odds| / (|odds| + 100). A −150 price implies 150 / 250 = 60.0%.
- Positive American odds: implied probability = 100 / (odds + 100). A +150 price implies 100 / 250 = 40.0%.
- Decimal odds: implied probability = 1 / decimal. Decimal 2.50 implies 40.0%.
Once both your bet and the close are in implied-probability form, CLV per bet is the difference in implied probability, in percentage points. A bet taken at +150 (40.0%) that closes at +130 (43.5%) is roughly 3.5 points of CLV, even though the raw odds moved only 20 cents.
Strip the vig so the comparison is fair
A two-way market rarely sums to 100%. If the close is −110 / −110, the implied probabilities sum to about 104.8%, and that extra 4.8% is the vig.
Do this on both your bet and the close, using the same method, or your CLV figure will drift with the book's margin rather than your skill. A common pattern is that bettors who skip vig removal overstate CLV on heavy favorites and understate it on longshots.
Pick one closing-line source and stick to it
This is where most CLV reports quietly break. The close you compare against has to come from the same book you bet at, captured near the actual market close. Mixing a sharp book's close with a recreational book's price produces a number that looks like edge but is really book-to-book spread.
- Book-specific close: most accurate for your own record, but requires the tool to support that book.
- Consensus or market-average close: useful for a broad benchmark, but it is not the line you could have bet.
- Exchange close: a clean fair-value reference, but only meaningful if you actually had access to that liquidity.
Whichever you choose, document it once and apply it to every bet. If a tool lets you switch reference books mid-season, your CLV history is no longer comparable to itself.
Timestamp the close, not the date
Record the closing line within a few minutes of kickoff, not hours before. Early "closing" numbers are just another opening line and will make your CLV look better than it is. Store the timestamp so you can audit it later, a report that says "closing line" without a time is not verifiable.
Sample size is the other trap. A hot month of beating the close tells you almost nothing. Judge the long-term edge across a full season, and report CLV per bet by category so a strong totals record cannot hide a weak spread record.
Validating a Sports Betting Model Edge Beyond a Single CLV Figure
A positive average CLV is necessary evidence, not sufficient proof.
Calibration asks a simple question: when the model says 60%, does that side win about 60% of the time?
Then split the record. Spread picks, moneyline picks, and totals often behave differently, and a strong totals record can hide a weak spread record.
Finally, ask what could change the outcome. Injuries, weather, and late line movement all shift fair value.
Frequently Asked Questions
What is closing line value in sports betting?
Closing line value (CLV) measures the difference between the odds you got on a bet and the final odds available just before the event started. If you bet a team at +150 and it closes at +130, you beat the close and earned positive CLV. The idea is that the closing line reflects the market's most informed price, so consistently beating it suggests your process has an edge. CLV is a process metric, not a guarantee of profit on any single wager.
How do you track closing line value?
Start by logging every bet with the exact odds, sportsbook, market, and timestamp. Then capture the closing line for the same market from a consistent source, such as the same sportsbook or a published consensus. Convert both prices to implied probability, subtract your entry price from the closing price, and record the difference. Doing this manually gets messy fast, which is why most bettors use a closing line value tracker like Pikkit or EdgeLine NFL to automate the capture and calculation.
How can you tell if a sports betting model has an edge?
A single CLV number is not enough. Look for a large enough sample size, consistent beat-the-close rate across bet types, calibration between projected probabilities and actual outcomes, and results that hold up out of sample. EdgeLine NFL separates official picks from lower-confidence model leans and publishes tracked performance, which lets you judge the model on its record rather than on a highlight reel. Treat any model as a probability estimate, not a certainty.
What is the difference between closing line value and expected value?
Expected value (EV) is a forward-looking estimate of what a bet should return on average given your assumed true probability. CLV is backward-looking: it measures whether the price you took beat the market's final price. A bet can have positive EV at the moment you place it and still lose CLV if the market moves against you before close. Tools like OddsJam focus on finding positive-EV prices, while a closing line value tracker focuses on grading the price you actually got.
How many bets do you need to evaluate a betting model?
There is no magic number, but small samples mislead. A few dozen bets can swing wildly on variance alone, so most analysts want hundreds of graded bets before drawing conclusions about a sports betting model edge. Combine sample size with beat-the-close rate, CLV per bet, and calibration checks. If a model looks strong over 30 bets, that is a signal to keep tracking, not a verdict. EdgeLine NFL's published records let you review results with the sport, season, and week identified.
The hard part isn't finding a dashboard. It's building a record honest enough to tell you when you're wrong. EdgeLine NFL was built for that: independent fair-line projections compared against live sportsbook lines, automated market movement and closing-line value tracking, and a clear split between official picks and lower-confidence leans. Get the Edge! Subscribe Now at https://www.edgelinenfl.com.
Bet responsibly. Wagering involves risk, and no model or projection guarantees an outcome.