Best NFL Betting System Alternatives for 2026

Table of Contents
- Why Standard NFL Betting Systems Underperform
- Bankroll Management for Sports Betting: The Foundation of Every System
- Point Spread vs Moneyline Betting Explained for System Builders
- Sports Betting Model Development: From Historical Data to Predictive Modeling
- NFL Player Props Strategy: Finding Edges Beyond the Spread
- EdgeLine NFL: An Alternative to Traditional Betting Systems
- Automated vs. Manual Systems and the Psychology of Betting
- Conclusion
- Frequently Asked Questions
Last Updated: October 2, 2026
Why Standard NFL Betting Systems Underperform
Most bettors lose money because standard NFL betting systems ignore the two forces that decide long-term results: the vig and variance. This guide from EdgeLine NFL breaks down alternatives to standard NFL betting systems, from flat betting and bankroll management to predictive modeling and player props. The core problem is structural. A system can win 55% of its picks and still bleed money if the average price is wrong.
The flat betting vs. scaled betting divide sits at the center of this. So does the juice every sportsbook charges on each wager.
The Flat Betting vs. Scaled Betting Divide
Flat betting means risking the same amount on every play, regardless of confidence. Scaled betting adjusts stake size based on edge, bankroll, or model probability.
Flat betting protects against volatility. Scaled betting can grow a bankroll faster when the model is accurate, but it amplifies losses when the model is wrong. Many experienced bettors use a hybrid: flat units for standard plays, scaled units only for the highest-confidence edges.
How the Vig Erodes Long-Term Returns
The vig, also called juice, is the commission built into every line. Standard spreads are priced around -110 on both sides, meaning you risk $110 to win $100.
That 10-cent gap means a bettor needs to win roughly 52.4% of bets just to break even. Most standard systems never account for this threshold.
Bankroll Management for Sports Betting: The Foundation of Every System
Bankroll management for sports betting is the practice of sizing every wager as a fixed percentage of total capital, so no single loss or cold streak wipes out your account. It is the single most important alternative to chasing picks.
Betting Units and Capital Preservation
A betting unit is a standardized stake, typically 1-2% of your total bankroll. If your bankroll is $5,000, a unit might be $50.
Capital preservation matters more than any single system. Bettors who risk 10% per game can lose their entire bankroll during a normal losing streak. Bettors who risk 1-2% survive variance and stay in the game long enough for their edge to play out.
- Set your unit size before the season starts
- Never increase unit size to chase losses
- Track every wager in a spreadsheet or app
- Review ROI monthly, not weekly
Point Spread vs Moneyline Betting Explained for System Builders
Point spread vs moneyline betting explained comes down to one question: do you want to bet on margin or on outright winner? The spread requires a team to win by a set number of points. The moneyline pays based on straight-up victory, with no margin involved. For a system builder, the choice is not stylistic, it is a pricing and probability decision that changes how your model has to be built.
Converting Lines Into Probabilities
Every market is a probability statement once you strip the vig. A -110 spread price implies roughly a 52.4% break-even rate. A -150 moneyline implies about 60%. A +130 underdog implies about 43.5%.
The practical rule: build your model to output a win probability, then compare that probability to the implied probability of every available market.
When Spreads Beat Moneylines (and Vice Versa)
Spreads offer more balanced pricing and lower vig on most games, which makes them better for high-volume, small-edge systems. Moneylines offer cleaner probability math because there is no push and no half-point, which makes them easier to model and easier to backtest. Totals carry their own dynamics, weather, pace, and coaching tendencies, and often move independently of the spread, which is why some modelers treat them as a separate system entirely.
| Market | What You Bet On | Typical Vig | Best For |
|---|---|---|---|
| Point spread | Margin of victory | -110 | Balanced pricing, high volume |
| Moneyline | Outright winner | Varies by favorite | Clean probability modeling, no pushes |
| Total points | Combined score | -110 | Weather and pace-based edges |
The Line Shopping Multiplier
The same game is rarely priced identically across every sportsbook. A half-point on a key number, 3, 7, 10, can swing the implied probability by several percentage points. A system builder who only bets at one book is leaving edge on the table before the game even kicks off. Track the best available price on every play, and treat the difference between your book's line and the market's best line as a cost you are paying for convenience.
Sports Betting Model Development: From Historical Data to Predictive Modeling
Sports betting model development is the process of turning historical NFL data into predictive modeling that estimates win probability better than the market. It replaces gut feel with expected value.
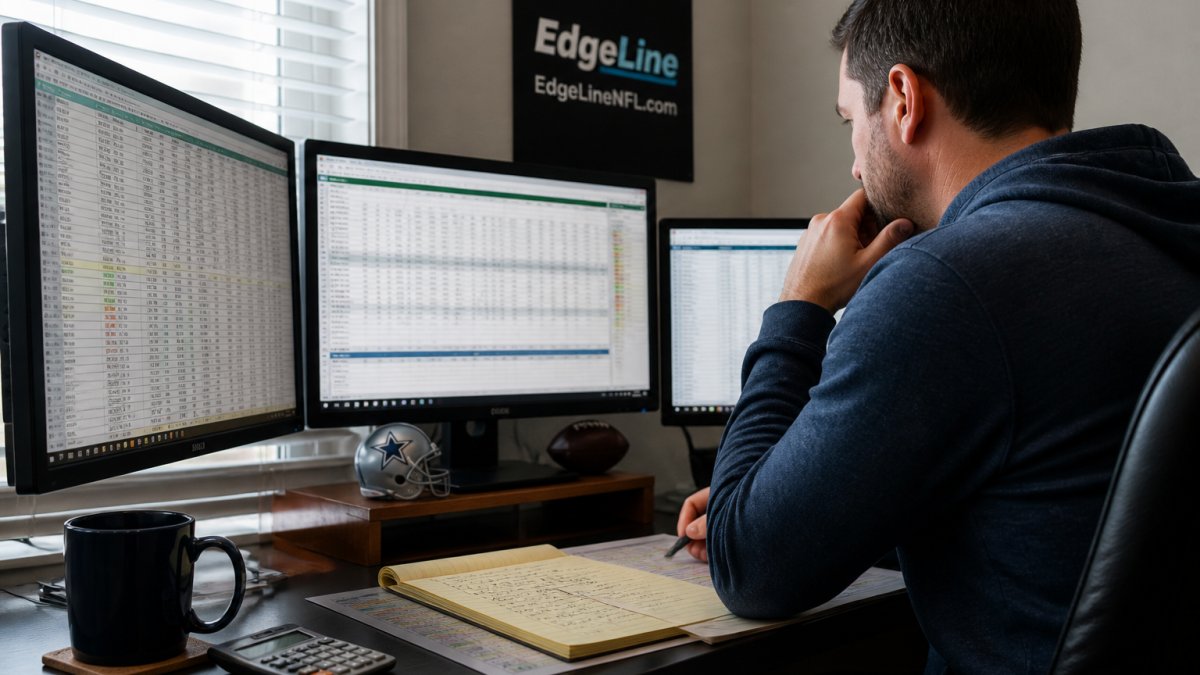
Start with clean historical data: closing lines, injuries, weather, and team efficiency metrics. Then build a baseline model and compare its projections against actual results.
Backtesting Methodologies and System Failure Analysis
Backtesting means running your model against past seasons to see how it would have performed. The trap is overfitting: tuning a model until it looks perfect on old data but fails on new games.
System failure analysis is the step most bettors skip. When a model breaks, ask why. Did the market adapt? Did the input data degrade? Did the model overfit?
NFL Player Props Strategy: Finding Edges Beyond the Spread
NFL player props strategy focuses on individual performance markets, like passing yards, receptions, and rushing attempts. These markets are often less efficient than spreads, which creates opportunity, but the opportunity is narrower and noisier than most guides admit, and the systems that fail are the ones that never tested whether their edge was real.
Why Props Are Priced Looser
Sportsbooks price props with wider margins and less sharp money, so mispriced lines survive longer. A receiver's target share, a running back's snap count, and a quarterback's pass volume are all projectable from historical data, but the market does not always update as fast as the spread does. An algorithm that projects a receiver's target share and compares it to the posted line can find edges the spread market already priced out.
The catch is volume. Player props move fast and require line shopping across multiple sportsbooks. Bettors who track closing-line value on props often find their real edge shows up there, not in raw win rate.
Backtesting a Prop Model Without Fooling Yourself
Backtesting a prop model is harder than backtesting a spread model because the inputs are less stable. A receiver's target share can shift after a quarterback change, a coaching change, or a single injury. The trap is overfitting: tuning the model until it looks perfect on old data but fails on new games.
A workable process:
- Pull historical prop lines and results for at least two full seasons.
- Split the data. Build the model on the first 70% of games, then test it on the final 30% you never touched.
- Track closing-line value, not just win rate. A prop system that wins 55% of bets but consistently beats the closing line is showing a real edge; one that wins 55% while losing to the closing line is showing luck.
- Re-run the holdout test every time you change a feature. If performance collapses on the holdout set, you overfit.
System Failure Analysis: When Prop Systems Break
Prop systems fail during specific game scripts. A passing-yards model built on average game flow breaks when a team jumps out to a three-score lead and runs the ball for the entire fourth quarter.
Documenting these failures is how you build something durable. When a prop model breaks, ask why. Did the market adapt? Did the input data degrade?
Automated vs. Manual Prop Tracking
Manual tracking works for a handful of props per week, but prop markets move fast and the number of available lines is large. Automated tracking, software that logs every line, every move, and every result, is the only realistic way to build a sample size large enough to trust. The trade-off is that automation removes the bettor's judgment, which is an advantage when the model is sound and a liability when the model is not.
EdgeLine NFL: An Alternative to Traditional Betting Systems
EdgeLine NFL is an independent analytics platform that compares live sportsbook lines against proprietary fair-line projections to surface model edges. For bettors tired of standard systems, it replaces guesswork with transparent, tracked results.
The platform separates official picks from lower-confidence model leans, so you always know how much conviction sits behind a play. Injury-aware matchup analytics fold in team efficiency and weather.
Pros and Cons
Pros:
- Independent fair-line projections compared against live sportsbook lines
- Transparent, verified performance tracking of all official picks
- Injury-aware matchup analytics incorporating team efficiency and weather
- Tiered confidence classifications separate official picks from model leans
- Automated market movement and closing-line value tracking
Cons:
- Built specifically for NFL markets, not year-round multi-sport coverage
- Requires comfort with probability and edge concepts to get full value
Automated vs. Manual Systems and the Psychology of Betting
Automated systems remove emotion from bet sizing and pick selection. Manual systems keep the bettor in control but expose them to tilt, recency bias, and chasing losses.
The psychological impact of betting systems is the angle most guides ignore. A model only works if you follow it during a losing streak. Bettors who abandon a sound system after three bad weeks never let the math play out.
Conclusion
The hardest part of betting is not finding an edge; it is staying disciplined when variance tests your resolve. EdgeLine NFL gives you the tools to do exactly that, with independent fair-line projections, transparent verified tracking, and automated closing-line value monitoring. If you want objective data instead of guesswork, get started with EdgeLine NFL.
Frequently Asked Questions
Why do standard NFL betting systems often underperform?
Standard NFL betting systems underperform because they rarely account for the sportsbook edge, or vig, which creates a built-in house advantage on every wager. Many systems also rely on fixed progression patterns like Martingale that ignore variance and volatility, leading to large drawdowns. Without incorporating line shopping, closing-line value, or risk-adjusted returns, these systems struggle to overcome the juice over a full season.
How does data-driven modeling differ from traditional betting systems?
Data-driven modeling uses historical data, predictive modeling, and win probability estimates to identify edges rather than relying on fixed rules. Traditional systems often apply the same bet size regardless of matchup quality. A model-based approach factors in team efficiency, injury metrics, weather, and market movement to produce expected value estimates. This allows bettors to separate high-confidence plays from lower-confidence leans and manage risk more effectively.
What is the role of bankroll management in modern NFL betting?
Bankroll management determines how much capital you risk on each wager, directly affecting your ability to survive variance. Using betting units, typically 1-2% of your bankroll per play, helps preserve capital during losing streaks. The Kelly criterion offers a more advanced approach by sizing bets based on edge and win probability. Without disciplined bankroll management, even a profitable model can lead to ruin during a cold stretch.
Are player prop markets more efficient than point spreads?
Player prop markets are often less efficient than point spreads because sportsbooks devote fewer resources to pricing them. This can create opportunities for bettors who use granular player-level data, such as target share, snap counts, and injury reports. However, props also carry higher variance and limits. An NFL player props strategy that combines historical data with injury-aware forecasts can find value, but it requires more research than standard spread betting.
How can EdgeLine NFL analytics improve your betting strategy?
EdgeLine NFL compares live sportsbook lines with proprietary fair-line projections to identify model edges and probability estimates. It provides transparent, verified performance tracking of all official picks, separating them from lower-confidence leans. The platform also tracks closing-line value and market movement, helping you understand whether you are beating the closing number. Injury-aware matchup analytics incorporate team efficiency and weather, giving you a more complete picture than standard betting systems.